


.webp)
Climate Risk Intelligence for Insurance: From Transfer to Reduction
Climate Risk Intelligence (CRI) has been a core focus for Buoyant since we launched in 2020. From the beginning, we’ve invested in several companies shaping the space while keeping a close eye on emerging opportunities. That year, we shared our first piece of research on the topic (here) and we’ve been following the evolution of the category ever since. Most recently, Sarah Devermann published new work with us on chronic climate risk (here).
This piece focuses on acute climate risk and the role of insurance, which is adapted from a presentation on this topic at our LP Summit earlier this year. With ever-present natural disasters and the potential for the Federal Emergency Management Agency (FEMA) to have its funding cut, our society and economy has never been as exposed to the impact of climate change.
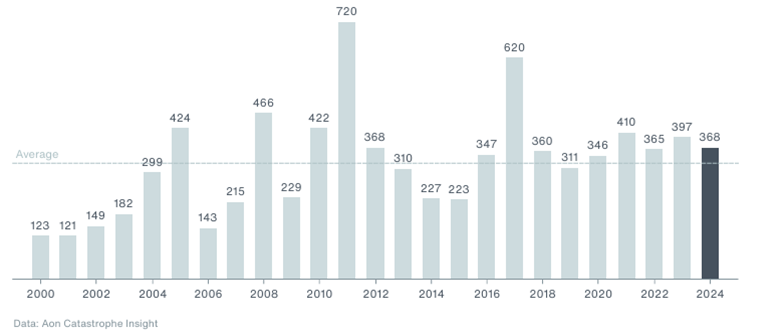
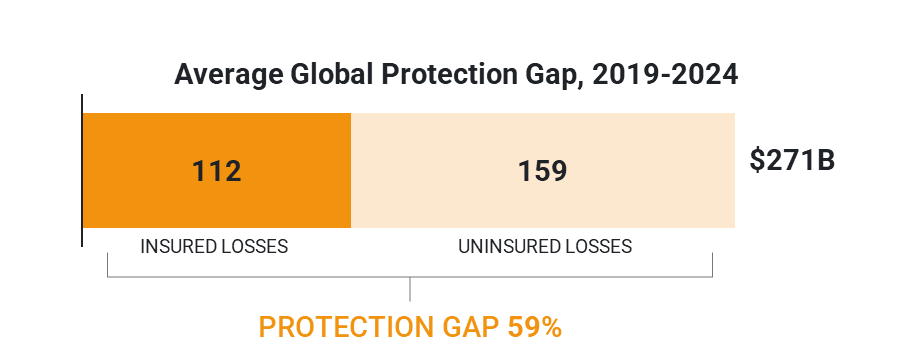
Acute physical risk refers to perils such as wildfires, storms, and floods. Across regions, these events are happening more often and causing larger losses, evidenced by the fact that the last five years have all landed above the long-run average for natural catastrophes. At the same time, the protection gap is widening. In the United States, about 60 percent of catastrophe losses are not insured and in many emerging markets the share is far higher (Aon). That is not only a problem for households and businesses, but also a growing concern for asset owners, insurers, and regulators.
Global Economic Losses from Natural Disasters (2024, $B)
Average Global Protection Gap (2019-2024)
US Insurers are being squeezed and FAIR plans are overstretched
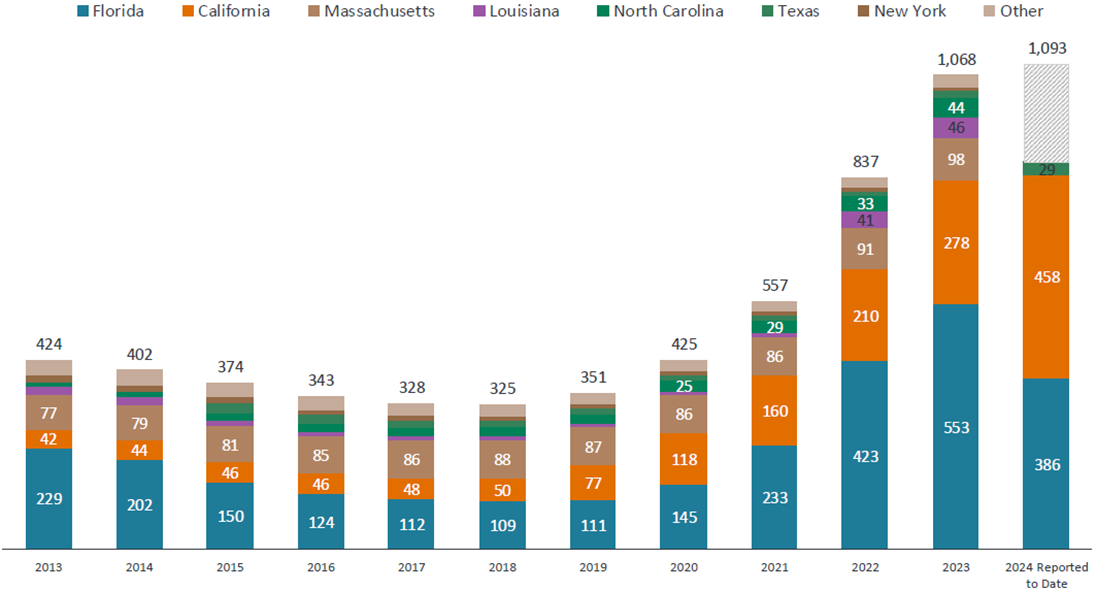
In the US, insurers are retreating from the highest risk areas. When carriers pull back, more homeowners end up on Fair Access to Insurance Requirements (FAIR) plans, the state programs that act as insurers of last resort. FAIR plans provide access to property insurance for homeowners who are denied access by the private markets due to high risk factors such as being located in an area prone to natural disasters. FAIR plans are funded by insurers that are licensed in the state. While FAIR plans provide a necessary safety net, as FAIR exposure grows (as seen in the chart below), those assessments increase and can further discourage private carriers from expanding in the same market.
Annual Exposure in FAIR Plans ($B)
California offers a clear case study. State Farm was not allowed to raise premiums enough to keep pace with risk and decided not to renew about thirty thousand policies. After the Los Angeles wildfires, regulators provisionally accepted a 17% premium increase (AP News), but only for existing policies while State Farm is not writing new policies. Without regulatory changes that better align price with risk, it is difficult to see what draws large carriers back to the places that need capacity most.
Climate signals and non-climate drivers
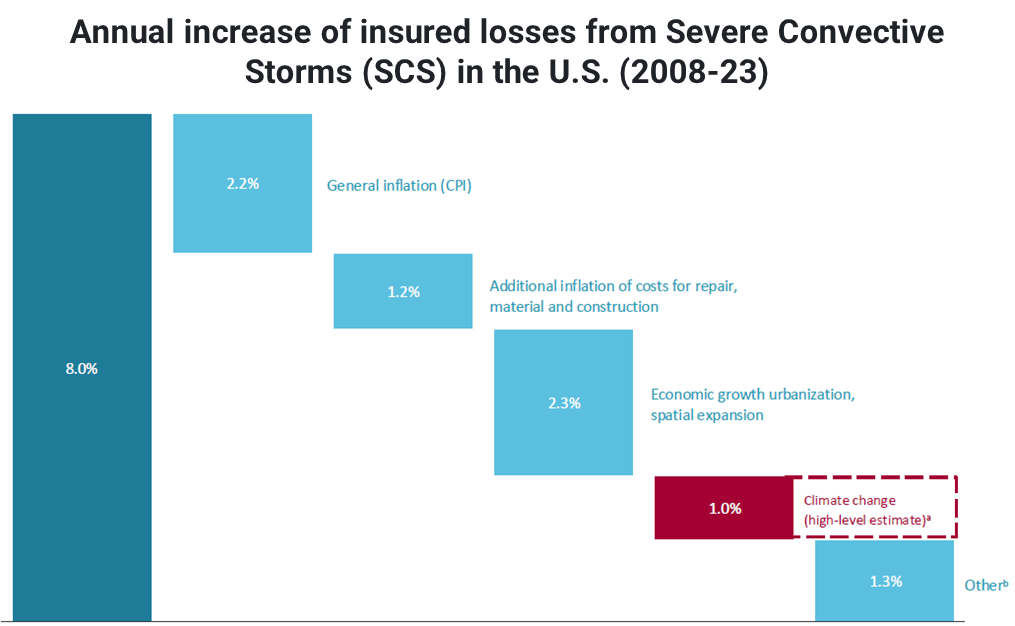
It’s not easy to tease apart how much of rising losses are driven by climate change versus other forces. Broader economic trends play a role too: inflation and growth naturally push insured values higher, while reconstruction costs for materials and labor have outpaced CPI in many markets, sometimes by as much as 18%. Looking at severe convective storms as one example, climate change appears to be on par with these non-climate drivers. So, while climate change is not the sole driver of increased losses, it is a significant driver and is compounded by other factors.
Why it matters for financial markets
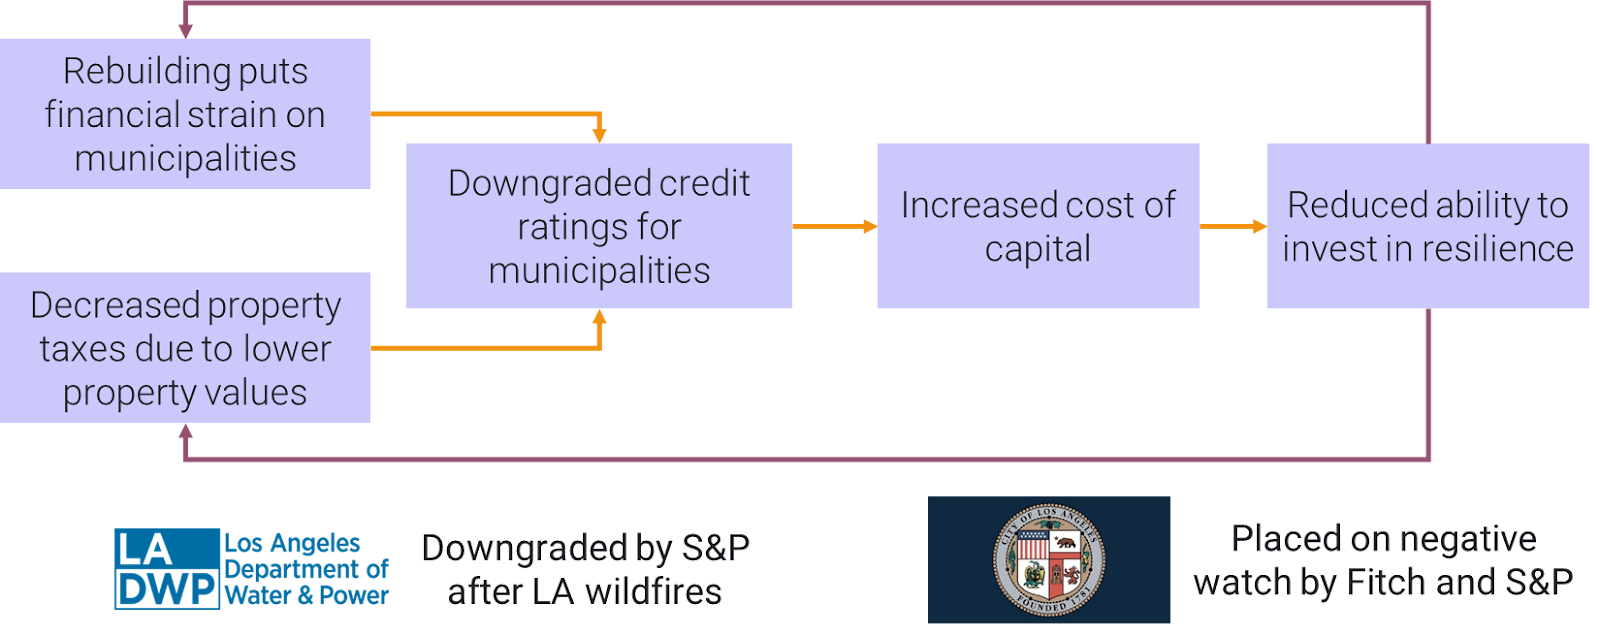
The implications extend beyond individual households and insurers. Local governments feel the strain when disasters hit since rebuilding demands capital at the same time that property values and property-tax revenues weaken, particularly where insurance costs jump or coverage becomes scarce. That fiscal pressure can lead to credit downgrades, which raise borrowing costs and limit investment in resilience. The result is a feedback loop that leaves communities more exposed to the next event.
Municipal bonds matter to the broader system, representing about 10% of the U.S. bond market and financing roughly 75% of infrastructure. If climate-amplified losses keep eroding local balance sheets, the cost of capital for critical infrastructure will rise just when communities need to be investing in resilience.
Impact of Losses on Municipalities
Opportunity for innovation
We cannot rely on risk transfer mechanisms alone. The system needs more capacity and better pricing, but it also needs less risk. The good news is that the return on risk reduction is compelling – a dollar invested in resilience can save roughly six dollars in losses on average, with meaningful variation by peril. Yet proven programs are underutilized, often because incentives are misaligned and because it is hard to coordinate action across a neighborhood or town.
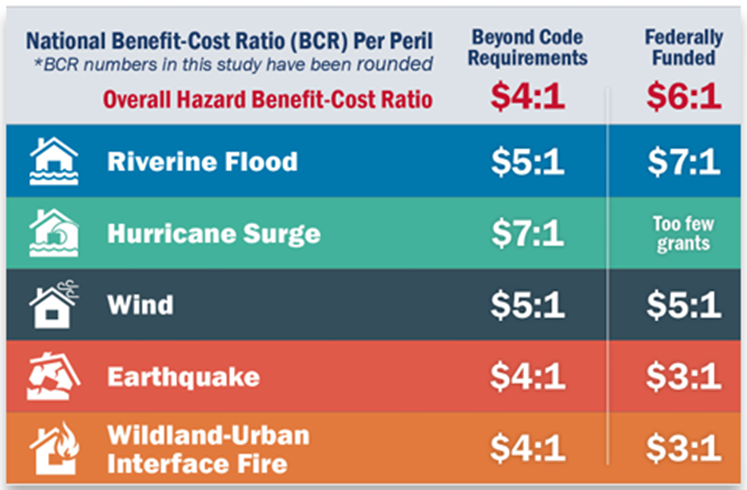
Two established frameworks point to what works in practice. IBHS’s FORTIFIED Home program has helped communities in the Southeast harden roofs, openings, and connections against wind. In the West, wildfire preparedness programs combine defensible space, hardening, and community planning. Both frameworks are practical and could scale much further with better incentives and coordination.
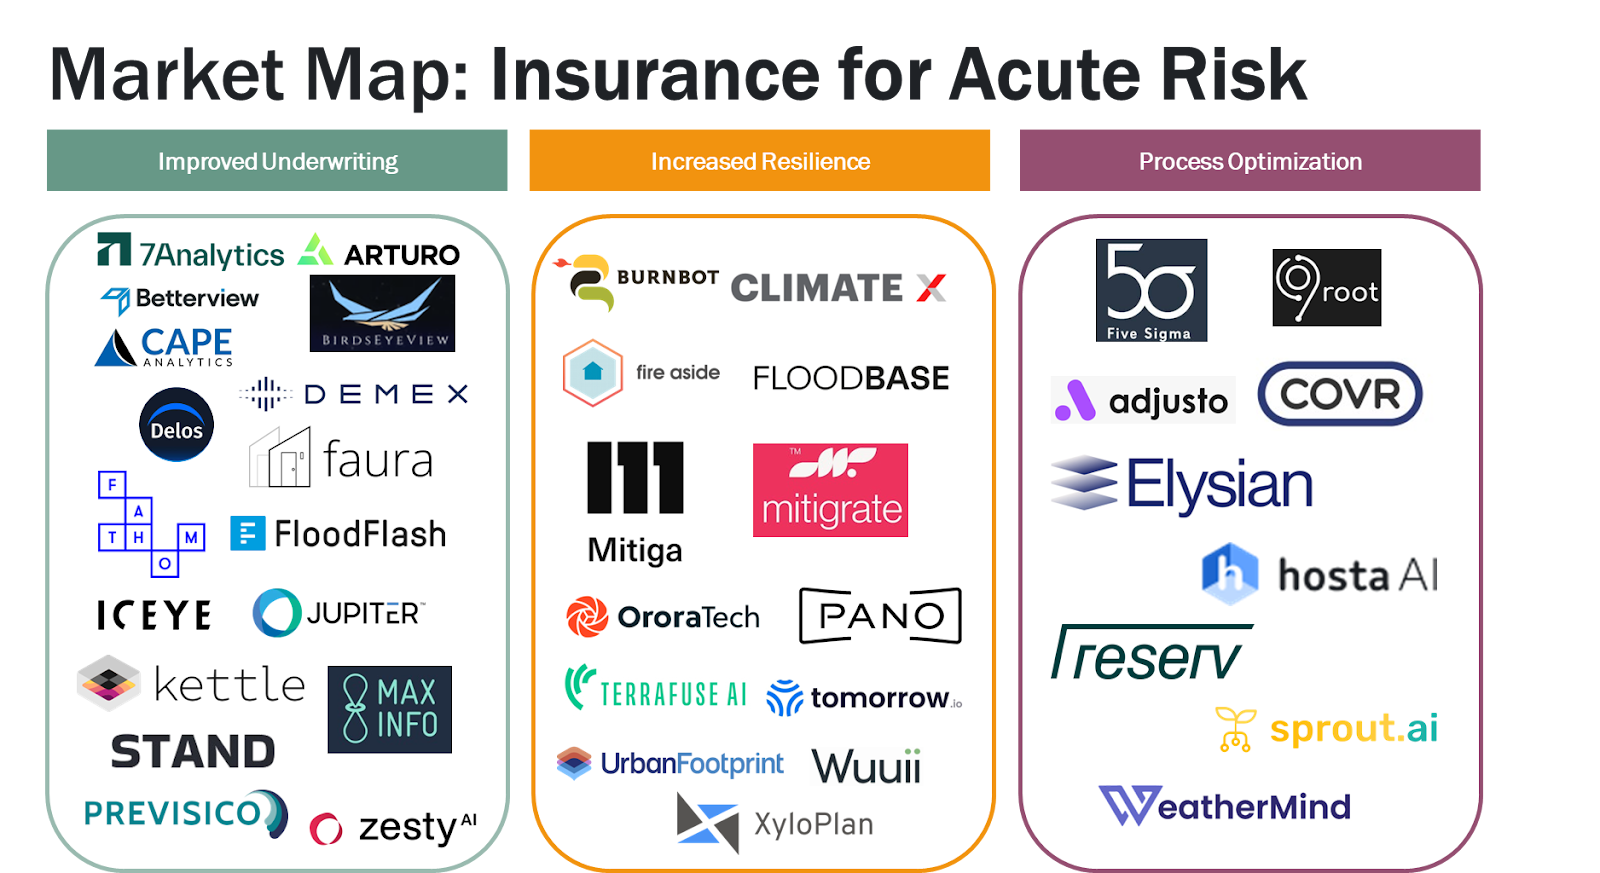
With that context, we see three categories of innovation for climate risk intelligence in insurance.
1) Improved Underwriting
Richer property data and forward-looking climate models allow carriers and MGAs to distinguish relatively lower-risk properties inside high-risk regions. That opens space to keep writing policies where coverage is scarce while protecting profitability. Examples include Faura, Delos, and Stand. The central design question remains. Insurance depends on pooling uncorrelated risk. If early products focus on a single peril in a single geography, how will portfolios diversify as they grow, and how will capital providers get comfortable that correlation risk is contained?
2) Increased Resilience
Natural disasters happen to communities, not individuals. Tools that prioritize the highest impact retrofits, verify the work, and coordinate at the community level can have a significant impact. Wuuii, a team we recently met, estimates that around 60% neighborhood participation is needed to shift wildfire outcomes in a meaningful way. That raises a classic collective action challenge – who pays, who benefits, and how do we align incentives across homeowners, HOAs, cities, and carriers?
3) Process Optimization
Catastrophe claims hit all at once and generate complicated, manual workflows. Automating intake, improving remote assessment, and accelerating documentation can reduce loss-adjustment expense and improve the customer experience. We are evaluating companies such as Weathermind that streamline claims and recovery. A question we are exploring is whether efficiency alone can bring carriers back into high-risk regions, or whether it needs to be paired with better underwriting and measurable resilience to shift the overall risk curve.
The market map below shows a few examples of companies innovating across these three areas.
What’s next?
We will continue to research climate risk intelligence with a specific emphasis on insurance models that reward risk reduction and on solutions that coordinate communities rather than isolated homeowners. The opportunities that stand out will quantify hazard and vulnerability at the property level with forward-looking views, will turn that analysis into clear incentives for verified mitigation, and will streamline the messy middle of claims and recovery so capital can flow to where it is most productive. If you are building a solution in this category, we’d love to talk to you!
We are also continuing our work on Climate Risk Intelligence more generally – stay tuned for more.
Thank you to the many experts who helped inform this research, including Liz Henderson, Global Head of Climate Risk Advisory at Aon; Tom Hutton, ex-CEO at RMS; Rob Lumley, Director and Co-founder at Insurtech Gateway; Peter Ortez, Principal at MunichRe Ventures; Barney Schauble, climate risk expert.
Related Posts
Subscribe to stay updated on news, insights, & invites to special events within our community.
We’re lighting the path forward for the ClimateTech industry—keep up with us along the journey.

